Web Visualizer
Graphmind includes a built-in web-based graph explorer at http://localhost:8080.
Gallery
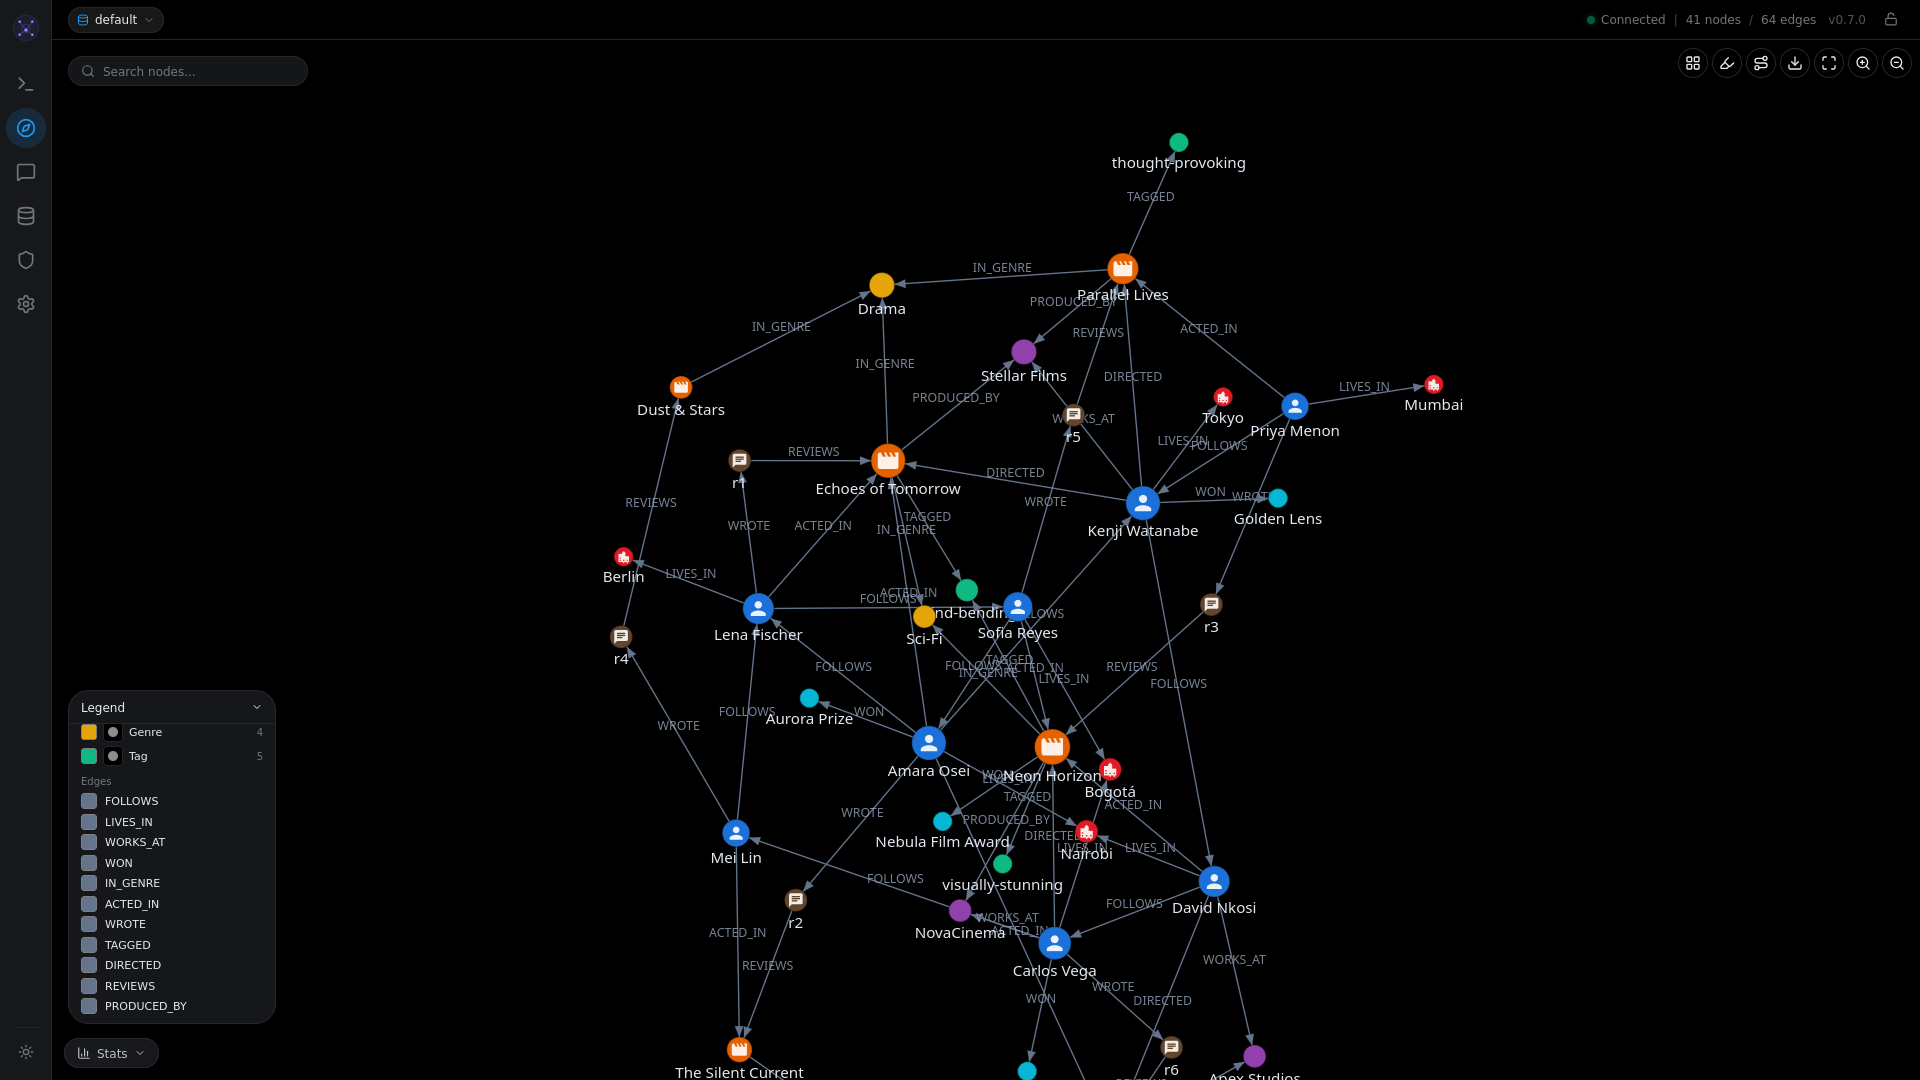
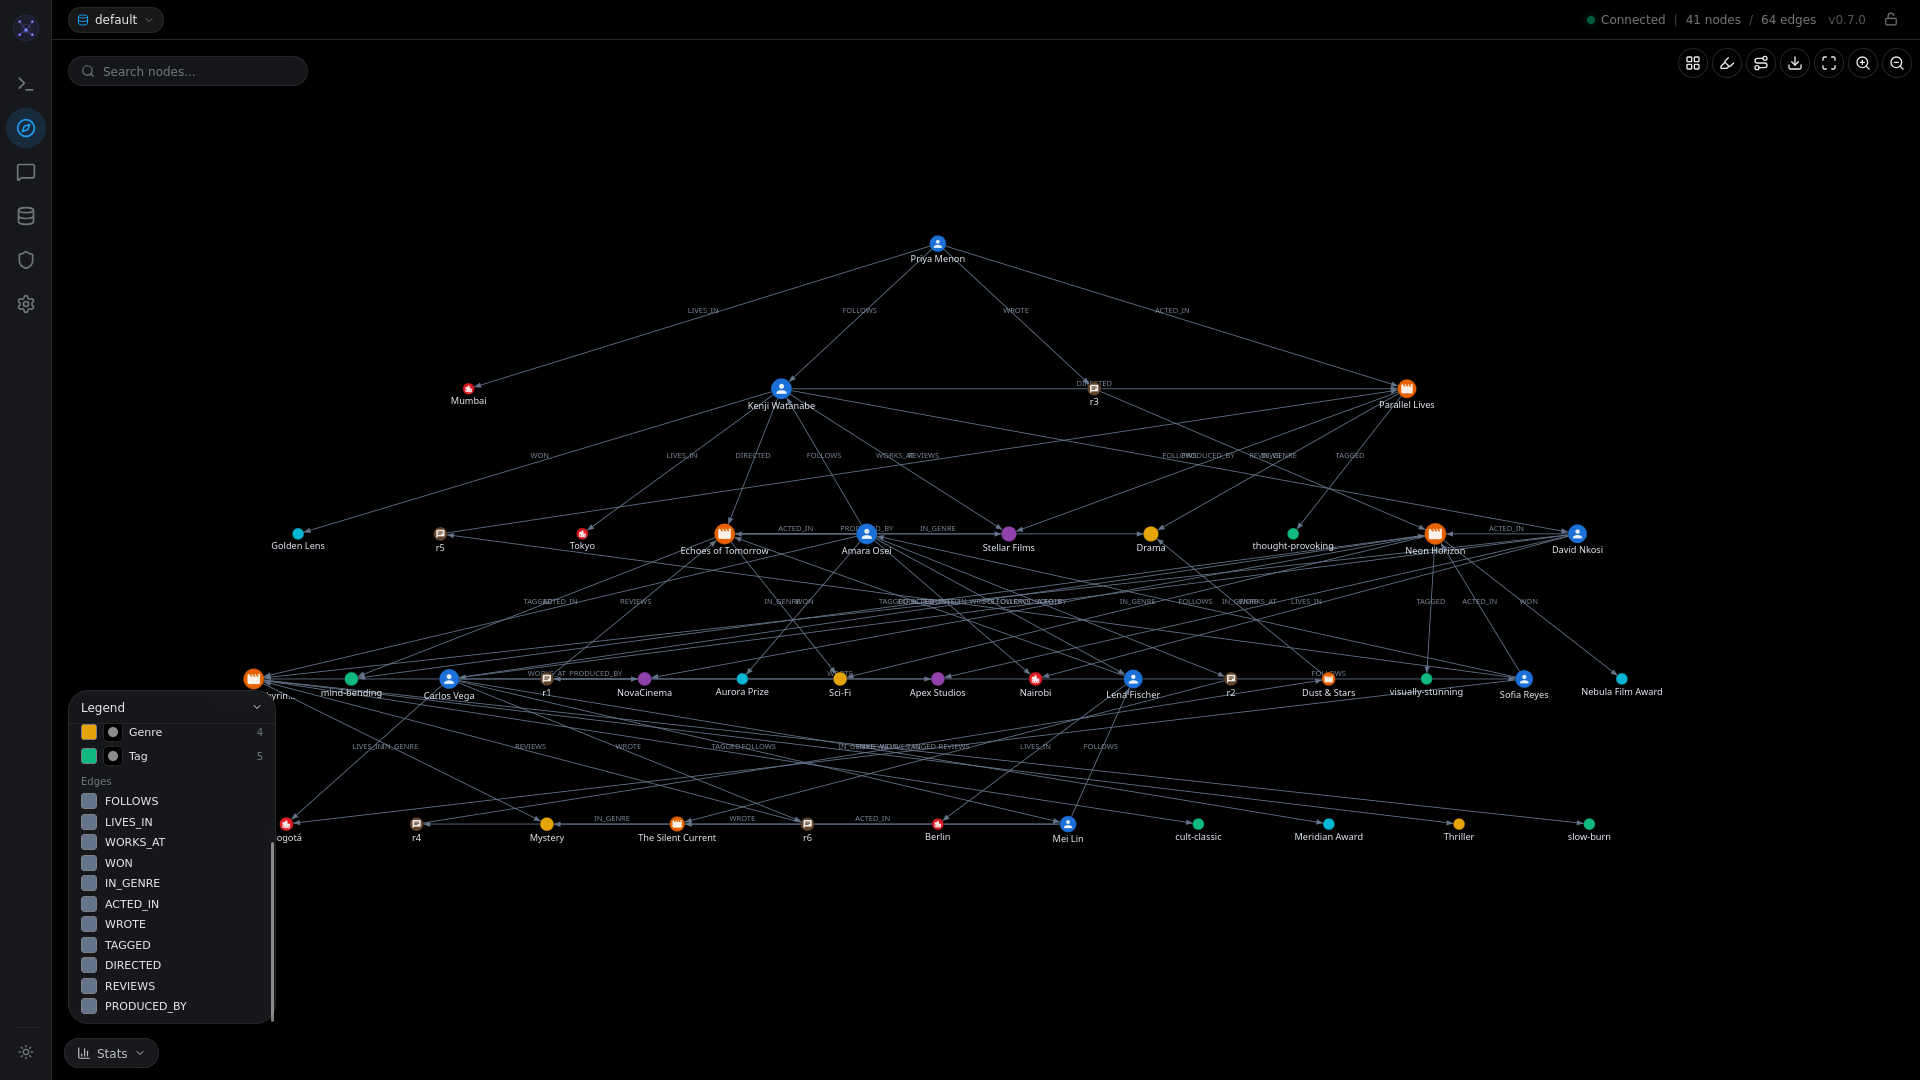
Graph Explorer
Force-directed graph with colored nodes, edge labels, and floating legend.
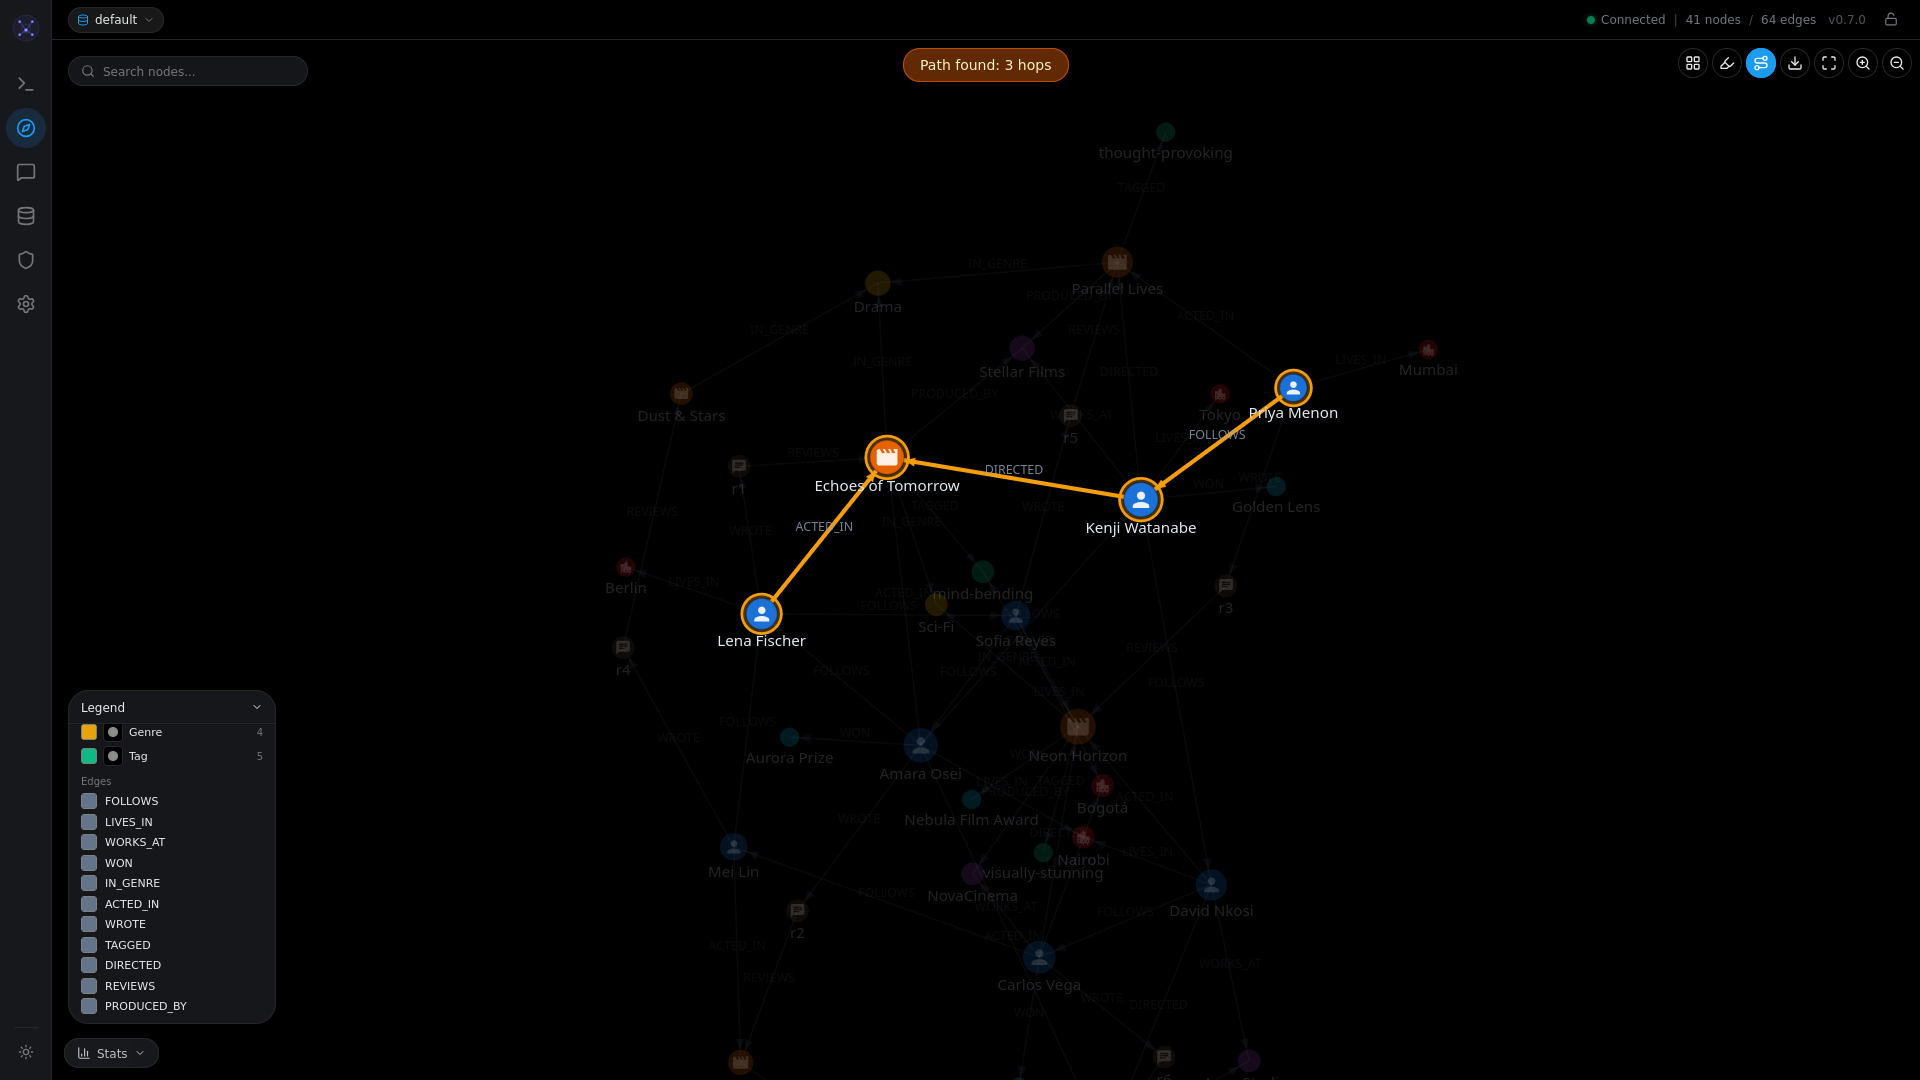
Shortest Path Visualization
Click two nodes to find and highlight the shortest path between them.
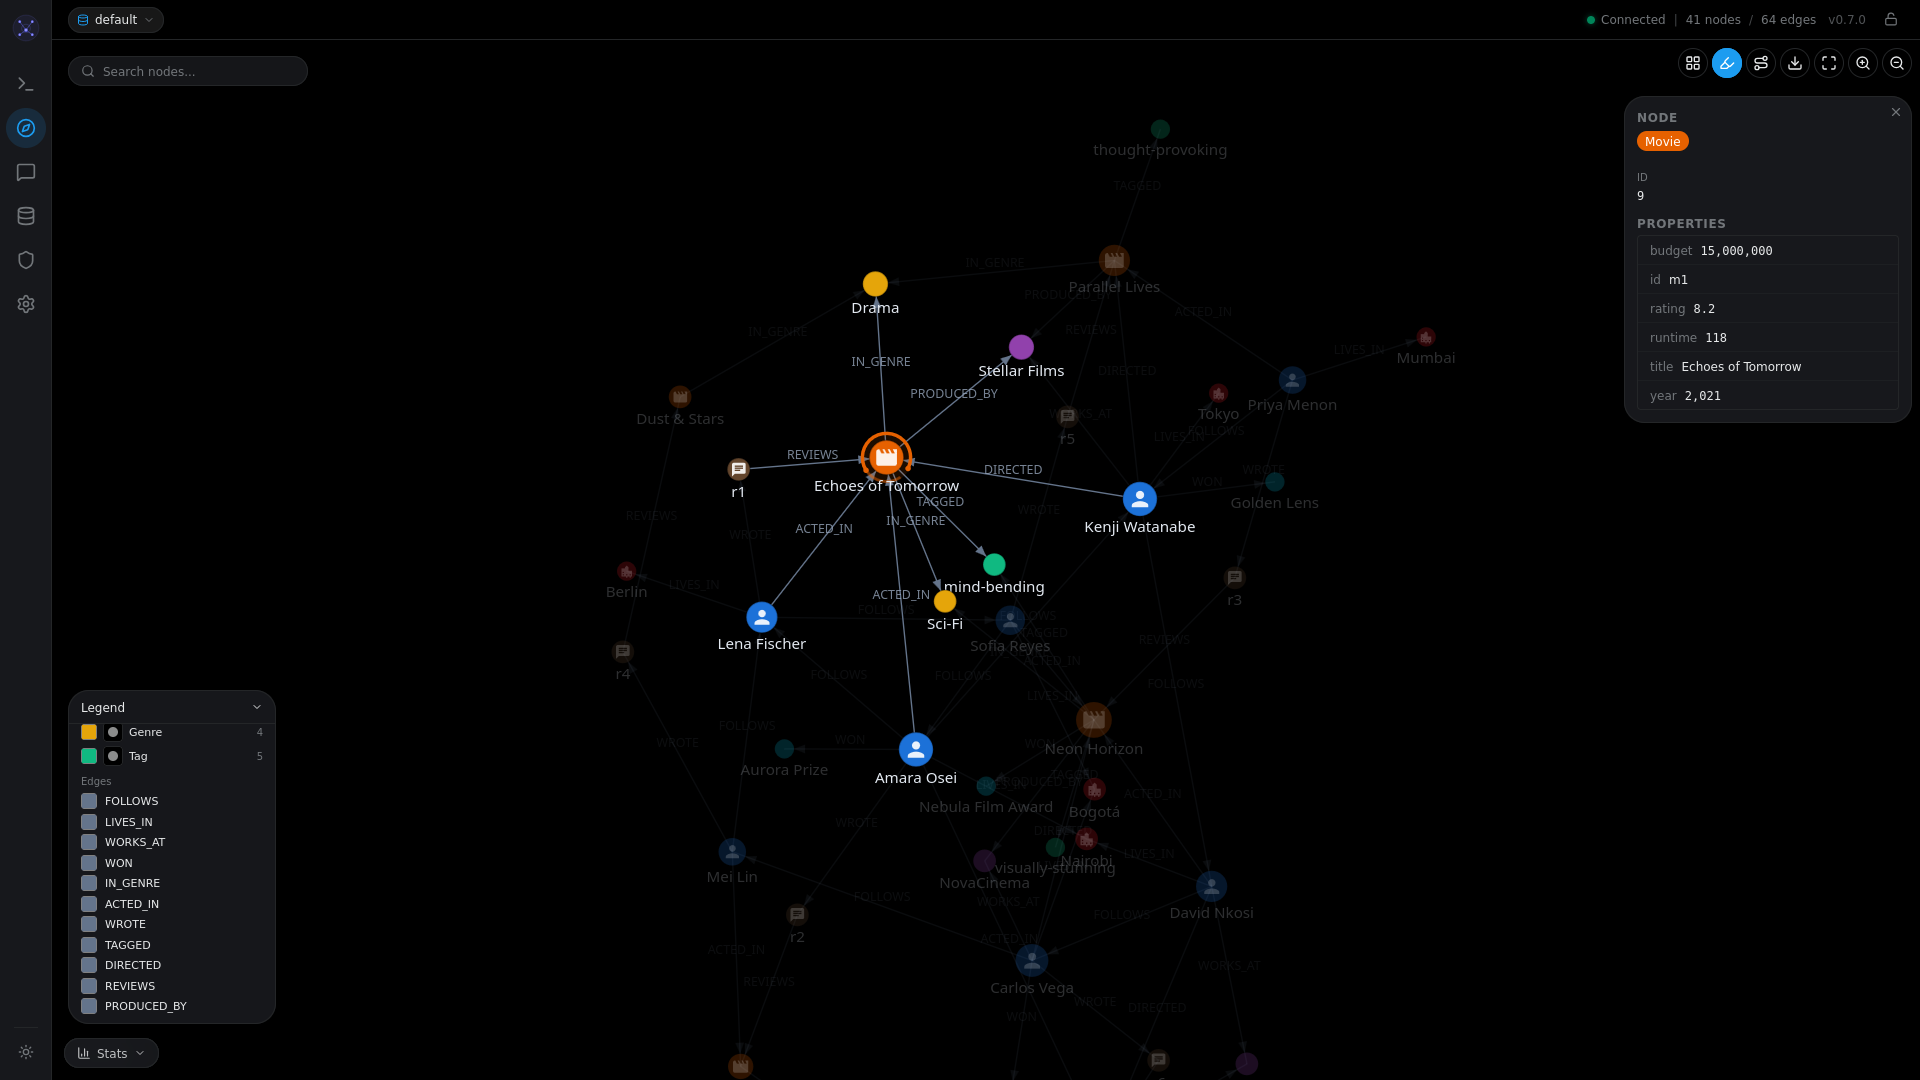
Node Inspector
Click any node to see its properties, labels, and connections.
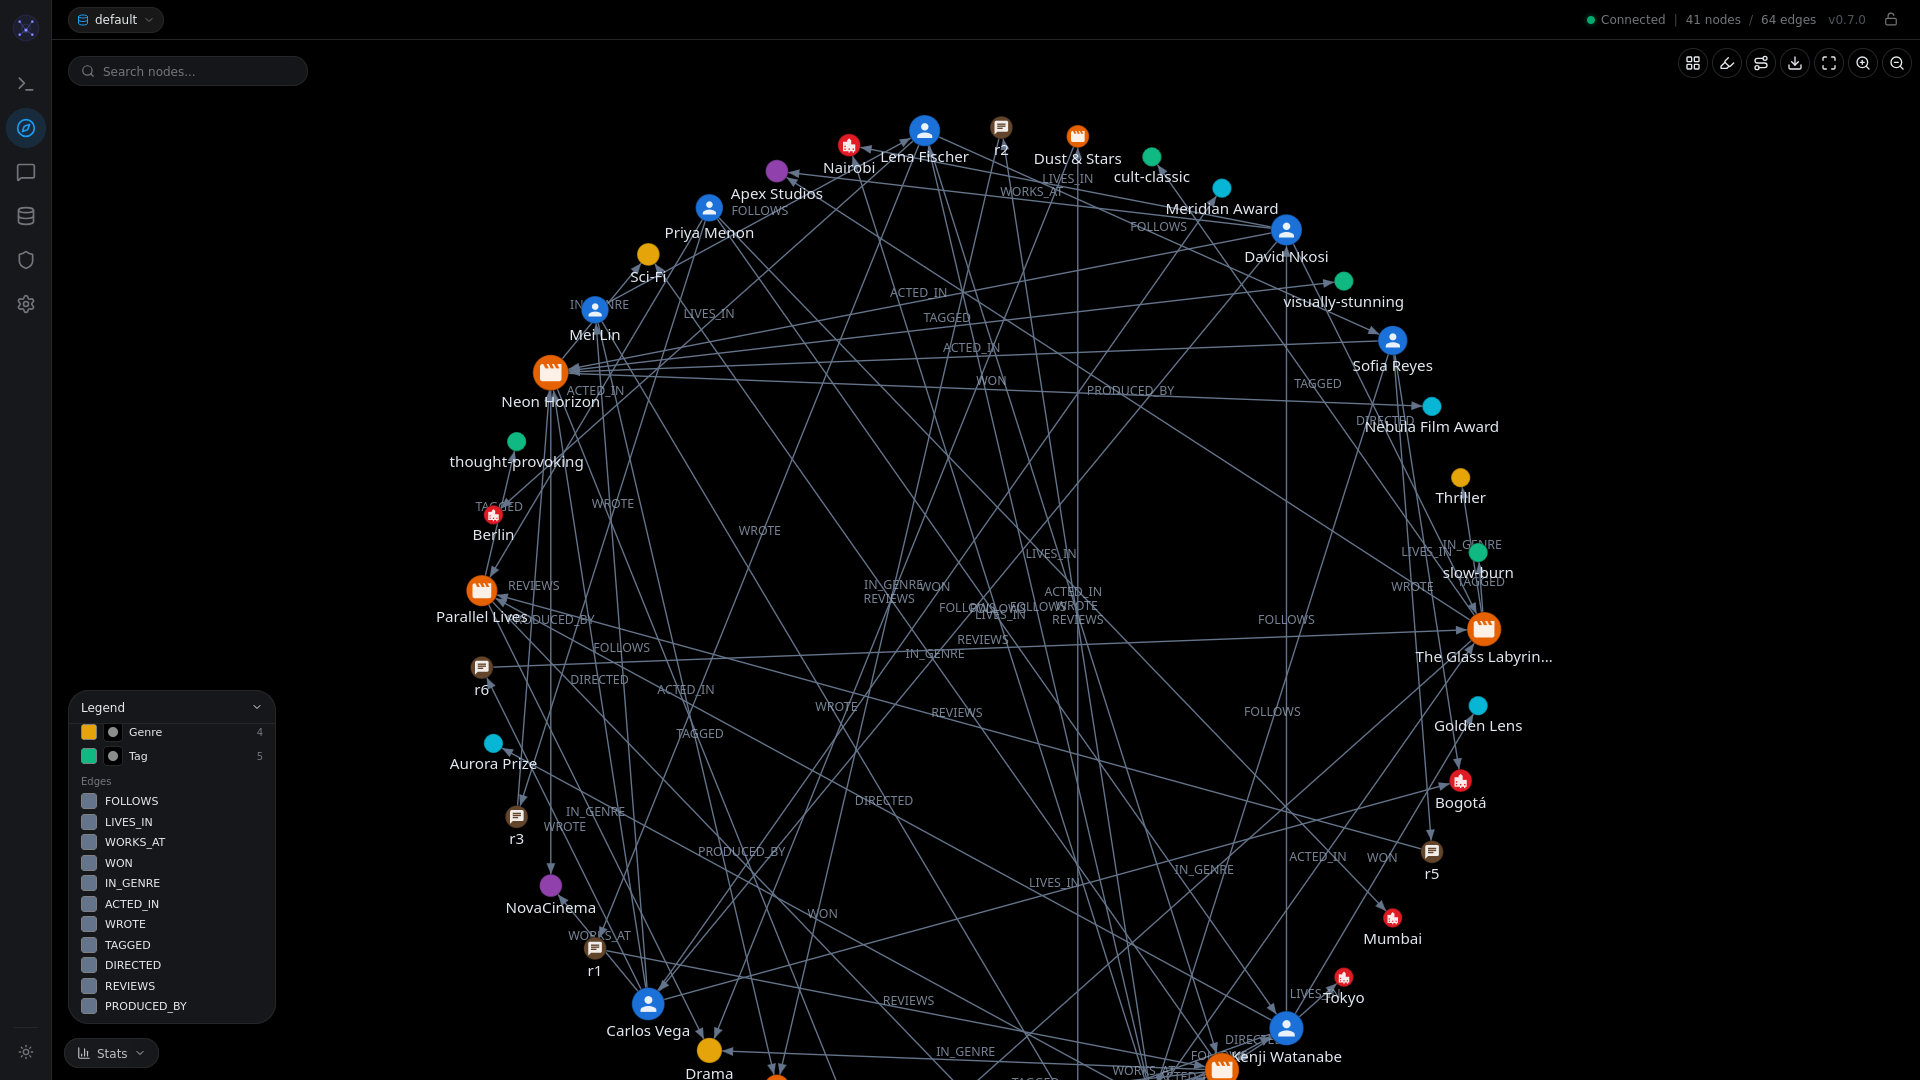
Graph Layouts
Switch between force-directed, circular, hierarchical, and grid layouts.
| Circular | Hierarchical |
|---|---|
 |  |
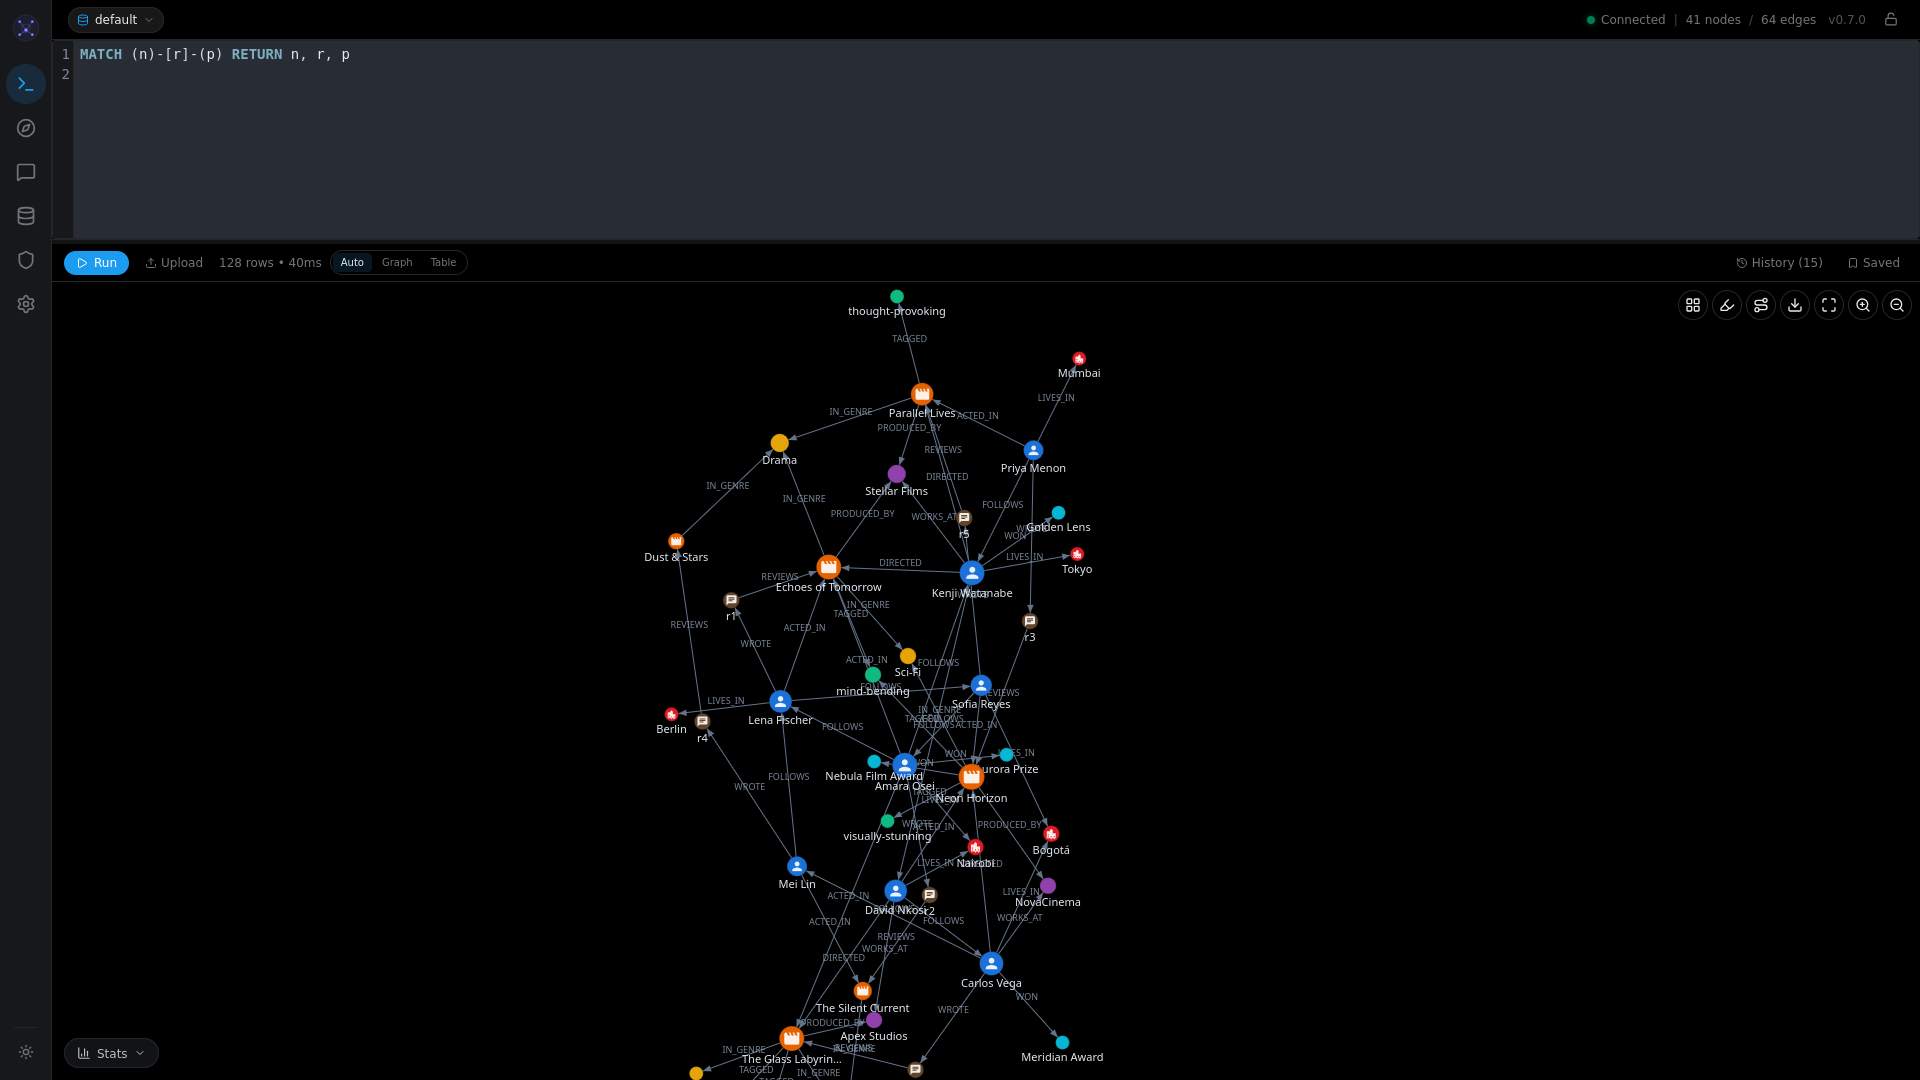
Query Editor
Full Cypher editor with syntax highlighting, autocomplete, and execution stats.
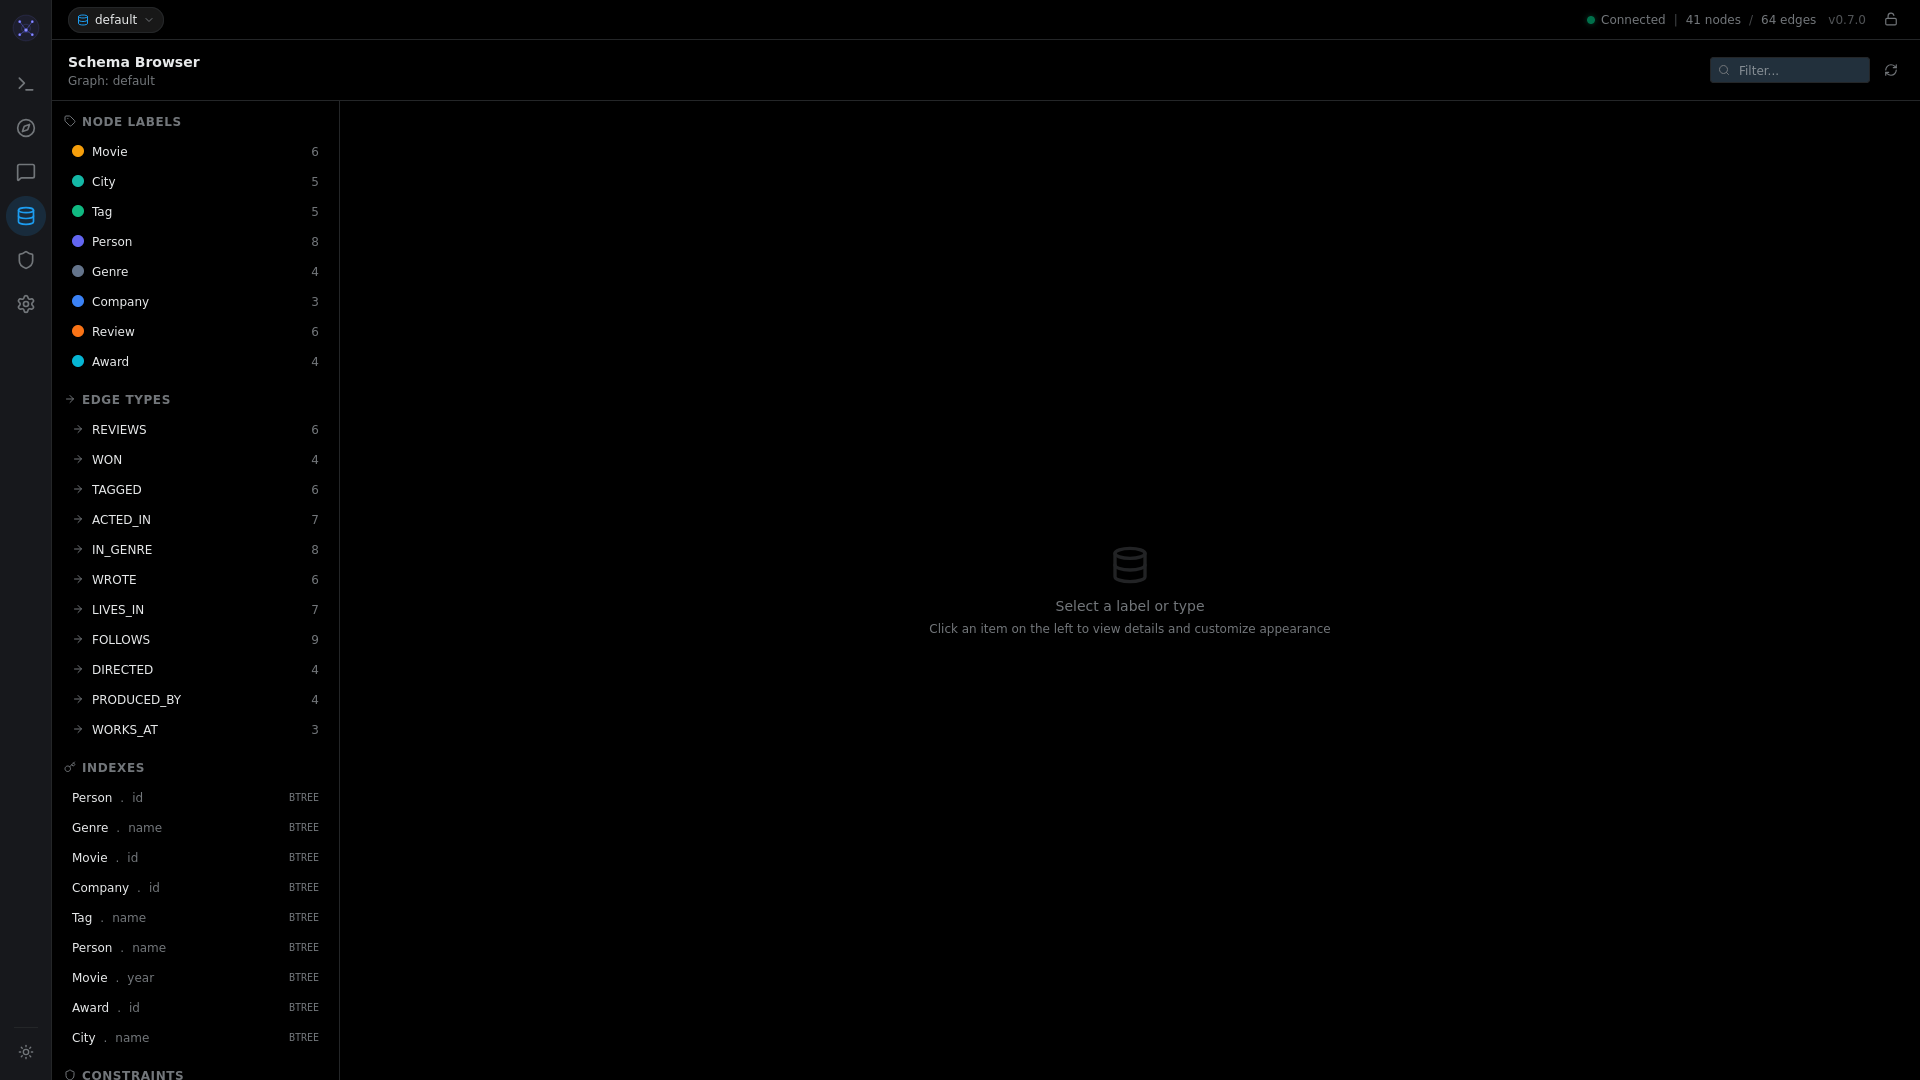
Schema Browser
Browse node labels, edge types, properties, and customize colors and icons.
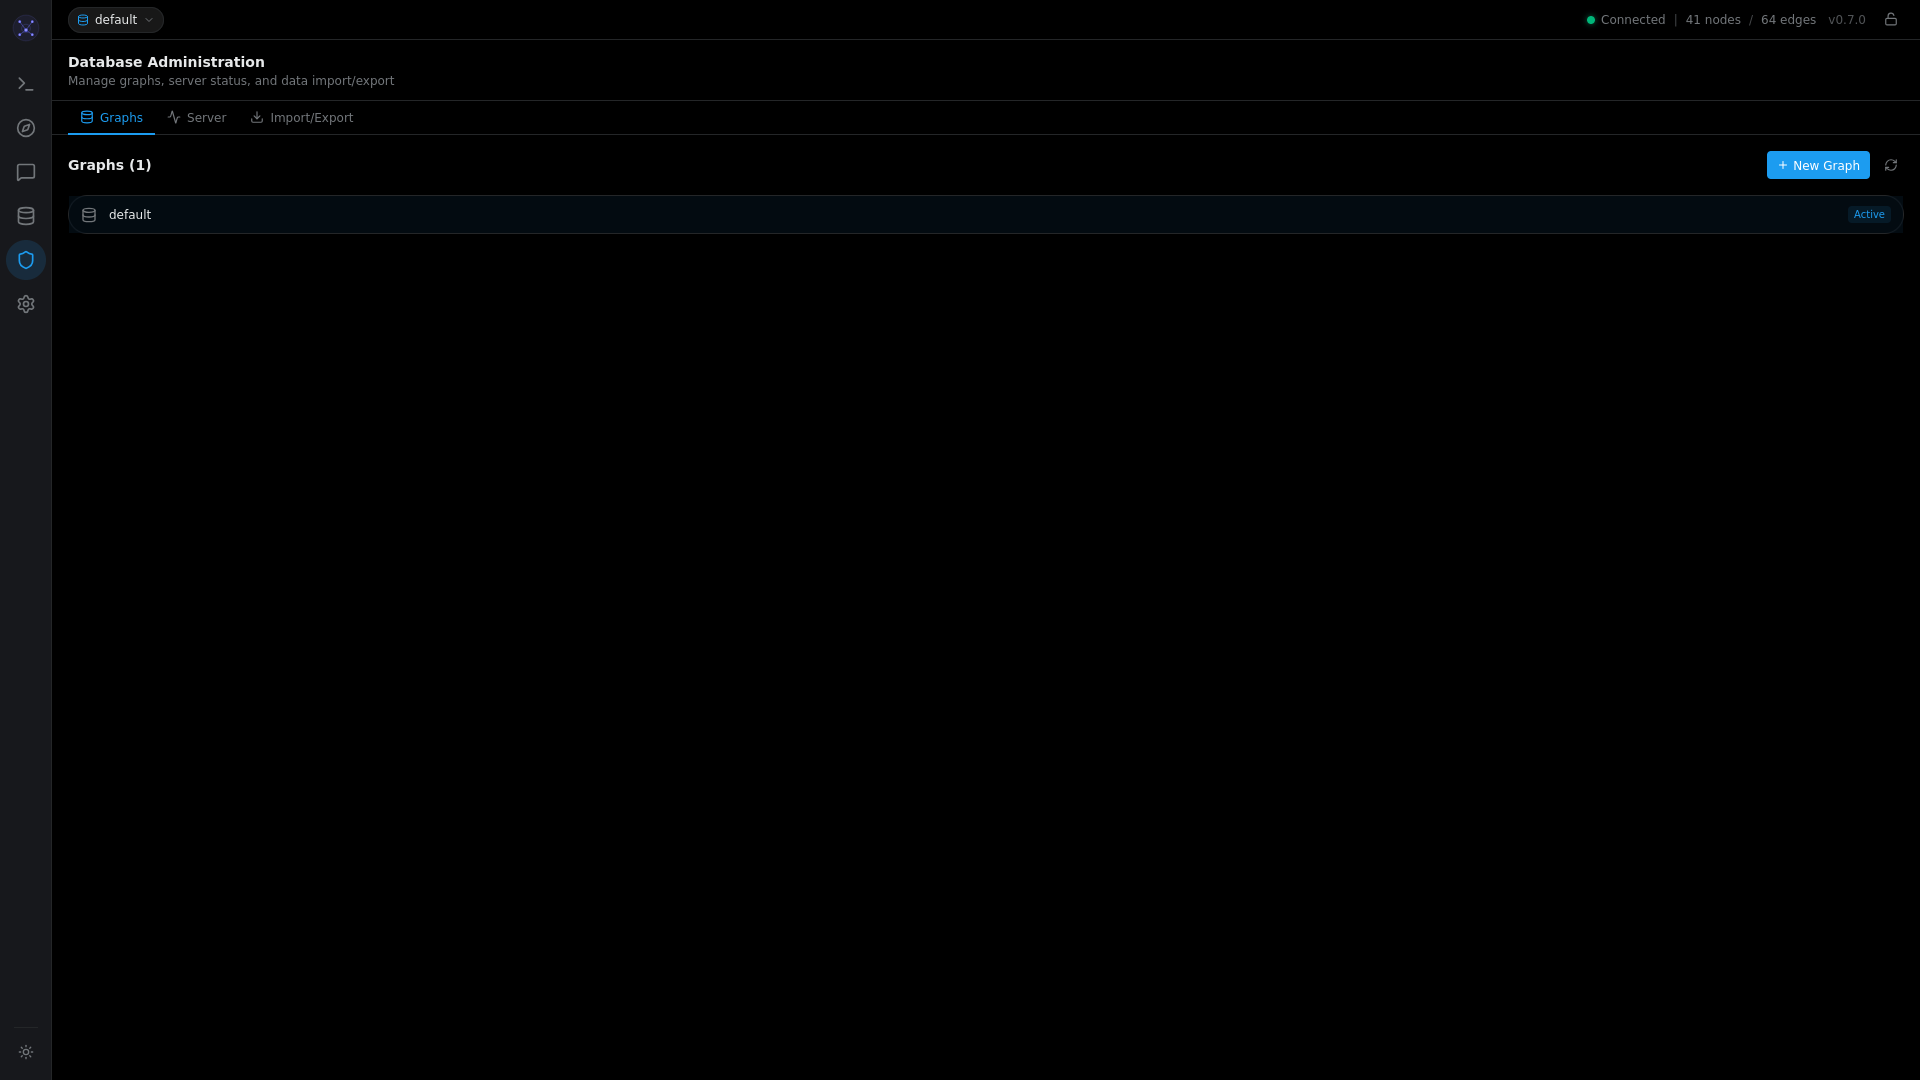
Database Administration
Manage graphs (multi-tenancy), view server stats, import/export data.
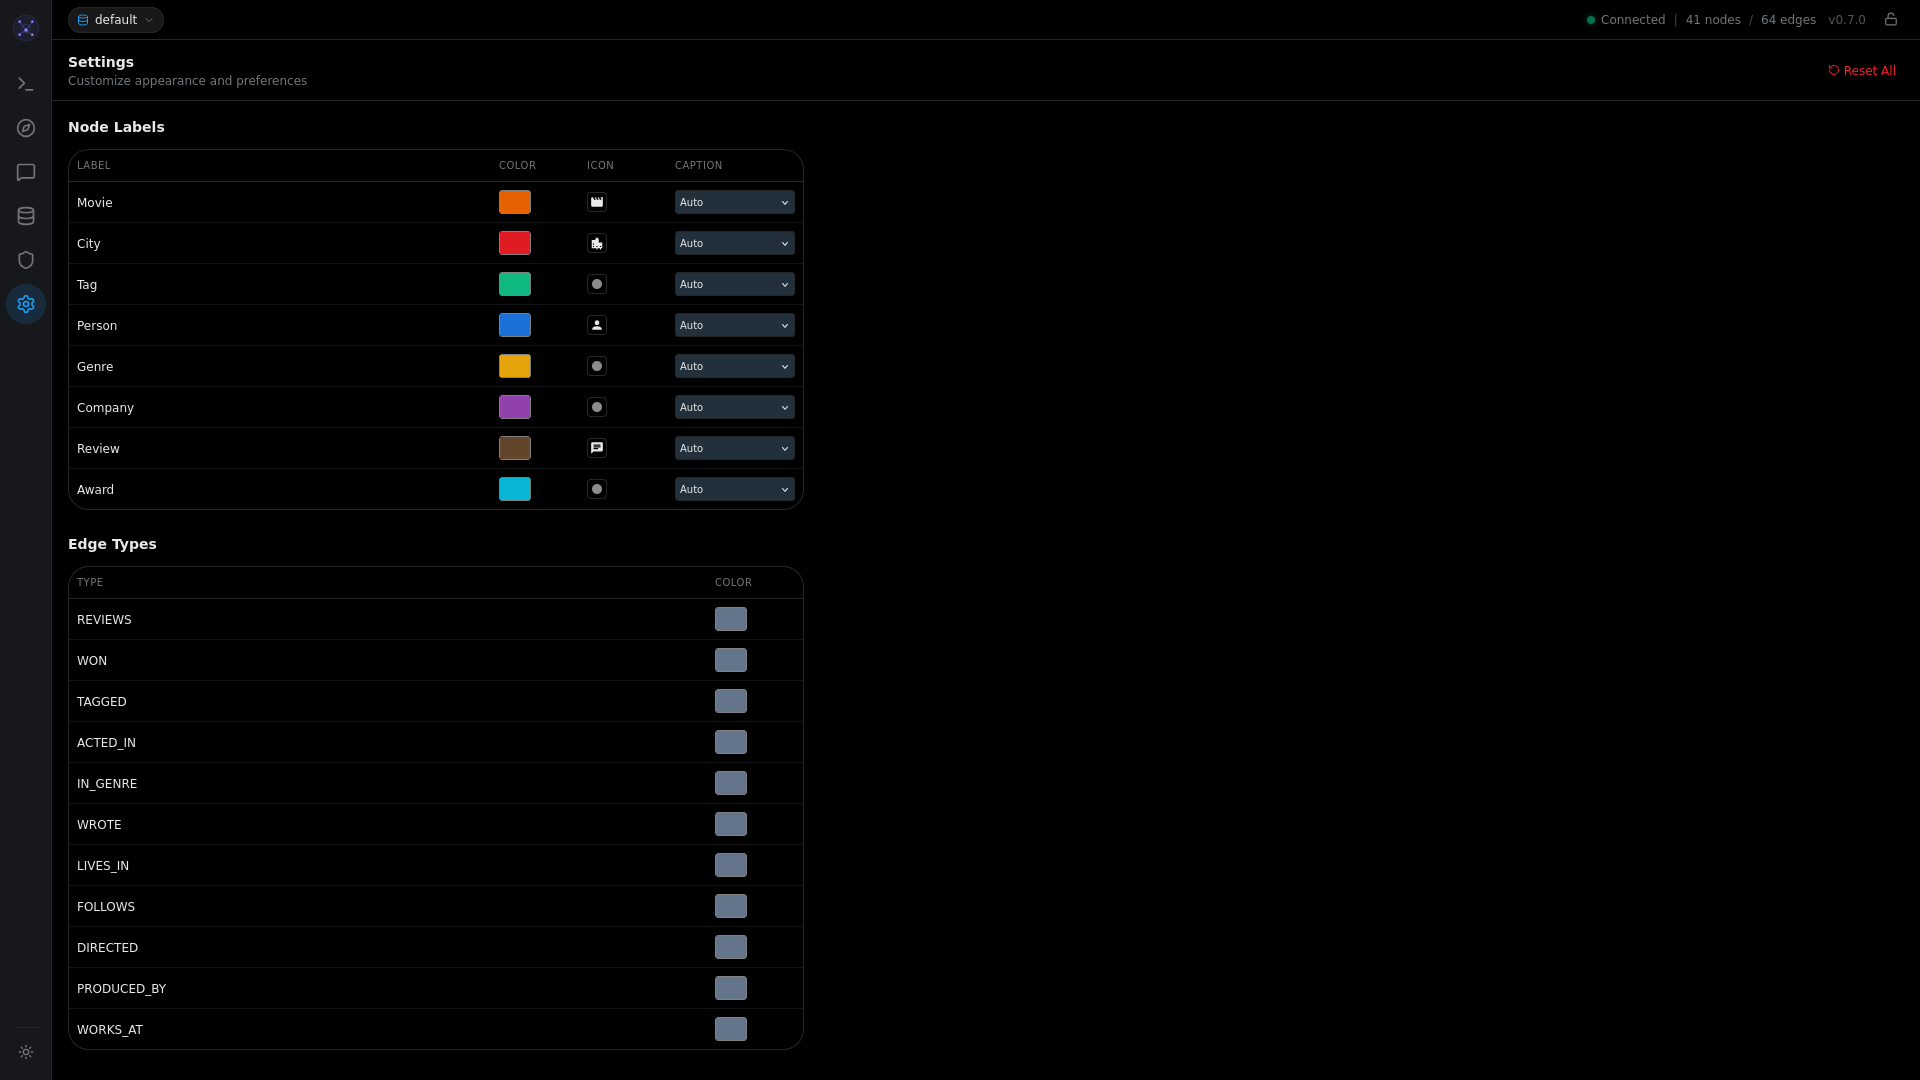
Settings
Customize node colors, icons, caption properties, and edge colors.
Opening the Visualizer
Start the Graphmind server, then open http://localhost:8080 in your browser.
# Start the server
graphmind

# Or with Docker
docker run -d -p 6379:6379 -p 8080:8080 fabischk/graphmind:latest
The visualizer works in all modern browsers (Chrome, Firefox, Safari, Edge).
What You Get
The interface has three main areas:
- Cypher Editor (top) -- write and execute Cypher queries with syntax highlighting and autocomplete
- Graph Canvas (center) -- interactive D3.js force-directed graph visualization
- Results Table (bottom) -- tabular query results with sortable columns
Quick Tour
- Run a query: Type a Cypher query in the editor and press
Ctrl+Enter - Explore the graph: Click nodes to inspect properties, drag to rearrange
- Expand neighbors: Right-click a node and select "Expand neighbors"
- Search: Type in the search bar to highlight matching nodes
- Change layout: Use the layout buttons (Force, Circular, Hierarchical, Grid)
- Fullscreen mode: Click the fullscreen button for immersive exploration
Loading Data
If the graph is empty, load the demo dataset:
- Click the upload button in the editor toolbar
- Select
scripts/social_network_demo.cypherfrom the repository - The script creates 52 nodes and 142 edges with 8 node labels and 10 relationship types
Or paste this into the editor:
CREATE (a:Person {name: "Alice", age: 30})
CREATE (b:Person {name: "Bob", age: 25})
CREATE (c:Person {name: "Carol", age: 28})
CREATE (a)-[:KNOWS]->(b)
CREATE (b)-[:KNOWS]->(c)
CREATE (a)-[:KNOWS]->(c)
Then query:
MATCH (p:Person)-[:KNOWS]->(f)
RETURN p, f
The nodes and relationships appear on the canvas. Click any node to see its properties in the inspector panel.
Next Steps
See Visualizer Features for the complete feature reference including:
- Keyboard shortcuts
- Color and icon customization
- NLQ (natural language) mode
- Export options
- Fullscreen explorer